Monday, July 24, 2023

Track in the rain

 
Tire track in asphalt

 
A tire tread impression left in the warm asphalt does not get washed away by the rain.
 
Seen in the wet street beneath our feet.

Tuesday, July 18, 2023

Waclaw Szpakowski - Rhythmic Lines (01)

Waclaw Szpakowski (Wacław Szpakowski - October 9, 1883 to February 7, 1973) was an architect who lived and worked in Poland and Latvia.  Aside from his professional work, he was also a 'doodler'.  His "doodles" are sinuous line figures that meander and wander across the pages of his notebooks.  
 
The year 2023 marks 140 years since his birth and 50 years after his passing.  These anniversary years have been noted with the exhibit "Vaclavs Špakovskis. Rīgas piezīmju grāmatas." at the Latvijas Nacionālais Mākslas Muzejs in Riga (https://www.lnmm.lv/) from March 2, 2023 to April 30, 2023.  The exhibition is of unprecedented scope and breadth.  It features his notebooks and line drawings, a number of which are seen publicly for the first time. 

"A10" (1924) - Waclaw Szpakowski

At first glance, his lines seem to be of random lengths, making 90 degree left and right turns when they wished.  A studied look reveals them to be intricate patterns shown as line drawings.

Szpakowski transformed many of these "doodles" from his notebooks into precisely drawn line figures.  He called these "Linie rytmiczne" [Rhythmic Lines].  He drew these using a Graphos, a technical drawing pen made by Pelikan.  The result was a uniform, unmodulated, one millimeter thick line. The gap between neighboring line segments would be four millimeters.  In effect, these were squares.  He often used 4x4 squares graphing paper.   Szpakowski created some of his line figures from repeated mirroring and flipping of horizontal and vertical portions of his design.  A look at these figures shows they could be fractals, maybe resembling the Sierpinski Triangle, or Greek key patterns, flat sheet heating elements, folded antennas, Hilbert space-filling curves, or, musical / sound waveforms?  

Szpakowski called these figures "rhythmical lines".  Tracing the lines can lead to a meditative quality to that experience.  In an interview, artist Anna Szpakowska-Kujawska, his daughter, says they should be called "linie psychiczne" (lines from the psyche, lines of the psyche) as they often reflected his moods and feelings when he drew them.  These figures have a devoted following and have a home on the web (see selected links below). 
 
=====================================================
 
 
These "rhythmical lines" lines can be seen as dividing a space into two parts or two areas – above and below the line.  They are also repetitive and can be viewed as waveforms.  His figures are made up of a positive half cycle, a negative half cycle, together forming one full cycle / period / wavelength.  Each line drawing represents one wavelength or several wavelengths, complicated in form as it may be.  It also has connectors at the left and right end of the figure.  These allows the figure to connect to copies of itself, creating a line, or a wave train, "ad infinitum".
 
By enclosing the line figure in a rectangle, we can examine the physical and mathematical properties of the figure.
 
R = number of rows = y-axis

R1 = row 1 = uppermost row

Rn = row n = bottommost row

C = number of columns = x-axis

C1 = column 1 = leftmost column

Cn = column n = rightmost column

A = area = R x C = number of squares in figure

slope = delta y-axis / delta x-axis = R / C  


P = perimeter = 2 x R + 2 x C

LL = line length = number of line segments (each segment is one square in length)


SOH CAH TOA
tan = opposite / adjacent
sin = opposite / hypotenuse
cos = adjacent / hypotenuse

slope formula
m = (y2 – y1)/(x2 – x1)
y = mx + b

An m × n matrix: the m rows are horizontal and the n columns are vertical. Each element of a matrix is often denoted by a variable with two subscripts. For example, a2,1 represents the element at the second row and first column of the matrix.
 
=====================================================

 
Szpakowski was prolific with his figure drawings.  For this study, we select his "A10" from 1924:
 
"A10" (1924) - Waclaw Szpakowski


This figure is enclosed in a rectangle to define its size and shape: 

A10 - enclosed by rectangle

 
Enclosing the figure allows us to color the parts that are separated by the line.  Contrasting colors are used to visually separate the areas above and below the line.  Here, yellow is used for above the line and pink for below the line.
 
A10 - colored in yellow and pink

 
Horizontal lines are overlayed on the colored figured to create a grid:

A10 - with grid lines

 
These colored squares in each row and column are counted.  The columns repeat three times (three wavelengths) so we can look at just columns 1 to 26.  The resulting numbers:
 
 
A10 rows and columns numbers of colors
A10 - number of colors by rows and columns

 
R = 25 (number of rows in enclosed figure)

C = 78 (number of columns in enclosed figure)
 
A = WxH = 78 x 25 = 1950 (area is the number of squares in figure)

RA = W/H = 78 / 25 = 3.12 (ratio of columns to rows)
 
P = 2(W+H) = 2 x (78 + 25) = 206 (perimeter)

 
=====================================================
 

Coloring the figure makes it easier to see the structure and patterns within figure A10.  On the left side, we can see the initial form A.  The horizontal flip of this form is to the right of it. The resulting pattern (the form A plus the horizontally flipped A) makes one wavelength that is repeated; in A10 it repeats three times.  The initial form A appears six times, three times as itself, and three times as its horizontally flipped image.

A10 - form A and horizontal flip
A10 - wavelength equals form A plus horizontal flip of form A
 

=====================================================
 
 
Looking at the bounded and colored A10, we can see that some rows are all yellow, some are all pink, and the rows and columns are mix of colors.  We can examine the color distribution (yellow and pink) for each row for the whole figure by graphing:


A10 - graph yellow pink colors
A10 - graph of yellow and pink colors by row

This reveals a distribution pattern.  The values of rows 1 to 13 are repeated in rows 13 to 25 but with a horizontal flip of the rows 13 to 25.  For example, row 3 is 33 yellow and 45 pink; the corresponding row 23 is 45 yellow and 33 pink, and so on.  This distribution can also be presented as:


A10 - graph of yellow and pink
A10 - graph of yellow and pink colors per row

This second graph reveals the oscillation of the colors on each row. looking across the columns within the waveform.  In rows 3 through 11 and rows 15 to 23, there always 33 columns of one color and 45 columns of the other color, the color depending on the row.  In the middle, we can see that there is an equal number (39) of both colors.  We also note that there are an equal number (975) of yellow and pink squares.


=====================================================
 
 
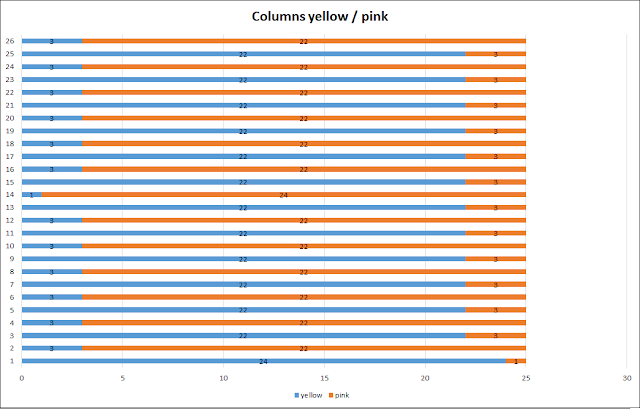
Similarly, we can examine the color distribution (yellow and pink) for each column in one wavelength for the whole figure by graphing:


A10 columns colors yellow pink
A10 - graph of yellow and pink colors by columns

This reveals a distribution pattern.  The values of columns 2 to 13 are repeated in columns rows 15 to 25 but with a flip of the columns 15 to 25.  For example, column 2 is 3 yellow and 22 pink; the corresponding column 15 is 22 yellow and 3 pink, and so on.  This distribution can also be presented as an oscillation of the colors across the columns within the waveform.  In columns 2 through 13 and columns 15 through 25, there always 22 rows of one color and 3 rows of the other color, the color depending on the column.  In column 14 (the middle of the waveform), we can see that there 1 yellow and 24 pink.  We also note that there are an equal number (325) of yellow and pink squares in the waveform.


A10 - graph columns yellow pink
A10 - graph of yellow and pink colors by columns

 
=====================================================


This closer look at the figures created by Waclaw Szpakowski reveals that not only are his figures composed of repeating waveforms but within these waveforms are also many smaller forms; together, these create the greater waveform.  There are also symmetries and regular oscillations.  This gives us a clearer insight into what he was thinking as he created these figures. 


=====================================================


More about the times in the life of Waclaw Szpakowski can be found at several web pages; these include:

https://waclawszpakowski.pl/    Website dedicated to the work of Wacław Szpakowski

https://culture.pl/en/artist/waclaw-szpakowski  Wacław Szpakowski  - Biography 


=========
=======================
=====================================================

Friday, July 14, 2023

Laughing clowns

 
Clown 4, 5, and 6
At the balloon races
 
Meet three of the clowns at the The Balloon Water Race.  This one had just three types of clown heads; different paint schemes make them look different.


Monday, July 10, 2023

Wide board door

 
Barn side door
Overgrowing

 
 The sliding door at the side of the barn will soon be overgrown by the grape vines.